
I conducted a large cohort study where I evaluated the average level of Bang! players on BGA Arena in the 6-player format.
The methodology was as follows. First, I downloaded the full list of participants from Season 24 of Bang! Arena. Then I had to clean the overall player pool a bit: I removed players who technically appeared in the Arena rankings as Bronze, Silver, and so on, but had not really played Arena. I also removed players with a very small number of games, because they do not represent the overall level of the field. Their sample size is too small, so they mostly create background noise.
At the same time, grinders who play a huge number of games also create background noise. So I limited the cohort to 100 games per player. As a result, around 600 players remained in the pool who matched the criteria.
From those players, I randomly selected 100 players. Then, for each of those 100 players, I took 100 Arena games and used that data to build the statistics and estimate the average level of the player base.
I also had to think about how to verify whether the results matched reality. In other words: how does this cohort compare to the entire field, or at least to a representative cross-section of the field? I needed some supporting arguments for that.
For this purpose, I introduced several objective indicators which, in my opinion, could be used to compare how well the cohort matches the overall player pool.
For the Sheriff, the metric was called average rounds reached. This means the average number of rounds a player survives as Sheriff.
For the Outlaws, I introduced an impact coefficient. I also introduced a similar impact coefficient for the Deputy.
Now, let’s go through everything step by step.
1. Overall
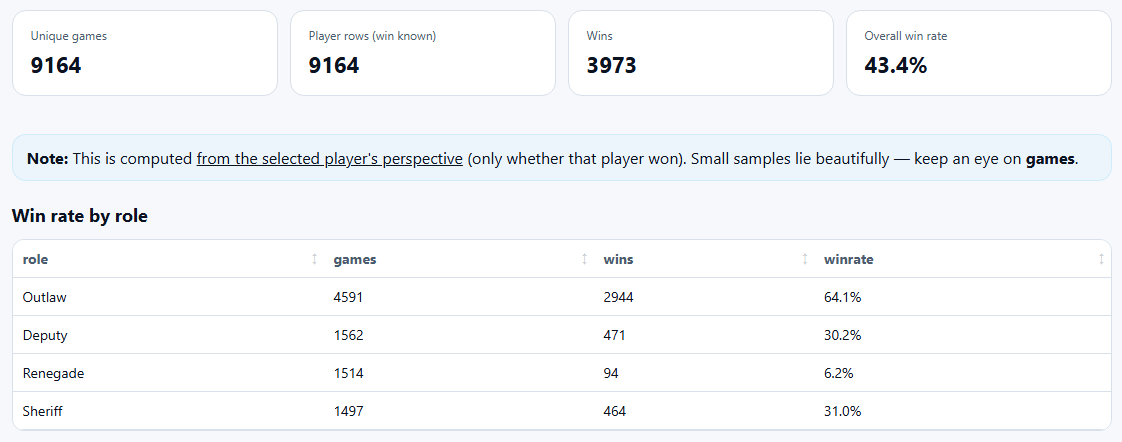
2.The Sheriff. In the cohort, the average number of rounds players survive as Sheriff is about 8 rounds. Then I took all Sheriff slots from the games in the cohort — that is more than 9,000 Sheriff slots — and checked whether this metric would be the same there.
And it turned out to be almost identical: the average number of rounds was also about 8, specifically 7.9.
Cohort

Overall pool
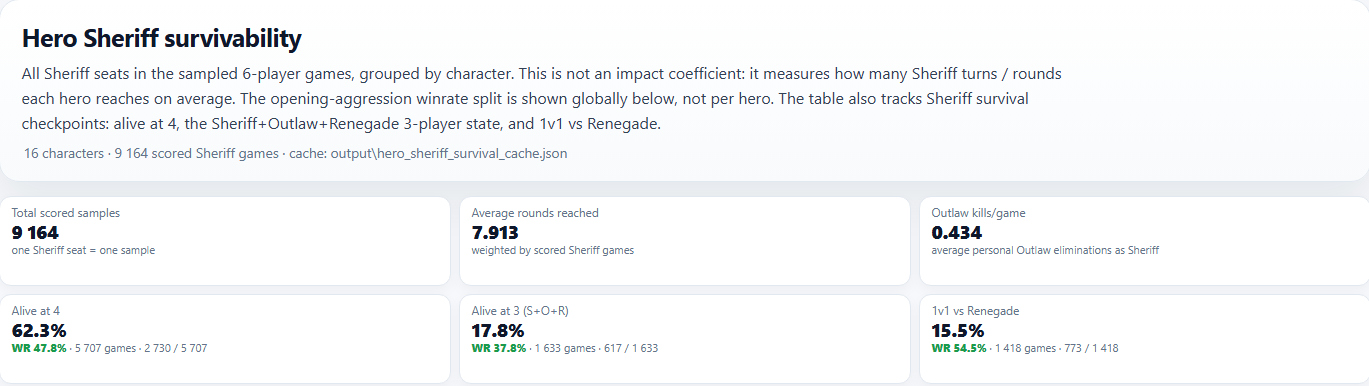
From this, I concluded that, at least for Sheriffs, the cohort matches the overall player pool quite well. Therefore, the character results from the cohort game pool should approximately reflect reality.
And the reality is the following.
Here are the screenshots where I show the Sheriff character results. In the columns, you can see the Sheriff win rate for each character across the overall player pool from the cohort games.
There are enough samples here to draw some conclusions.
You can also see a column for each character’s average rounds reached, meaning how long they survive on average as Sheriff. There are also some specific situations, such as win rate in a three-player endgame, and win rate in a 1v1 against the Renegade.
However, for those specific situations, the sample size is quite small. So we can only talk about tendencies there.
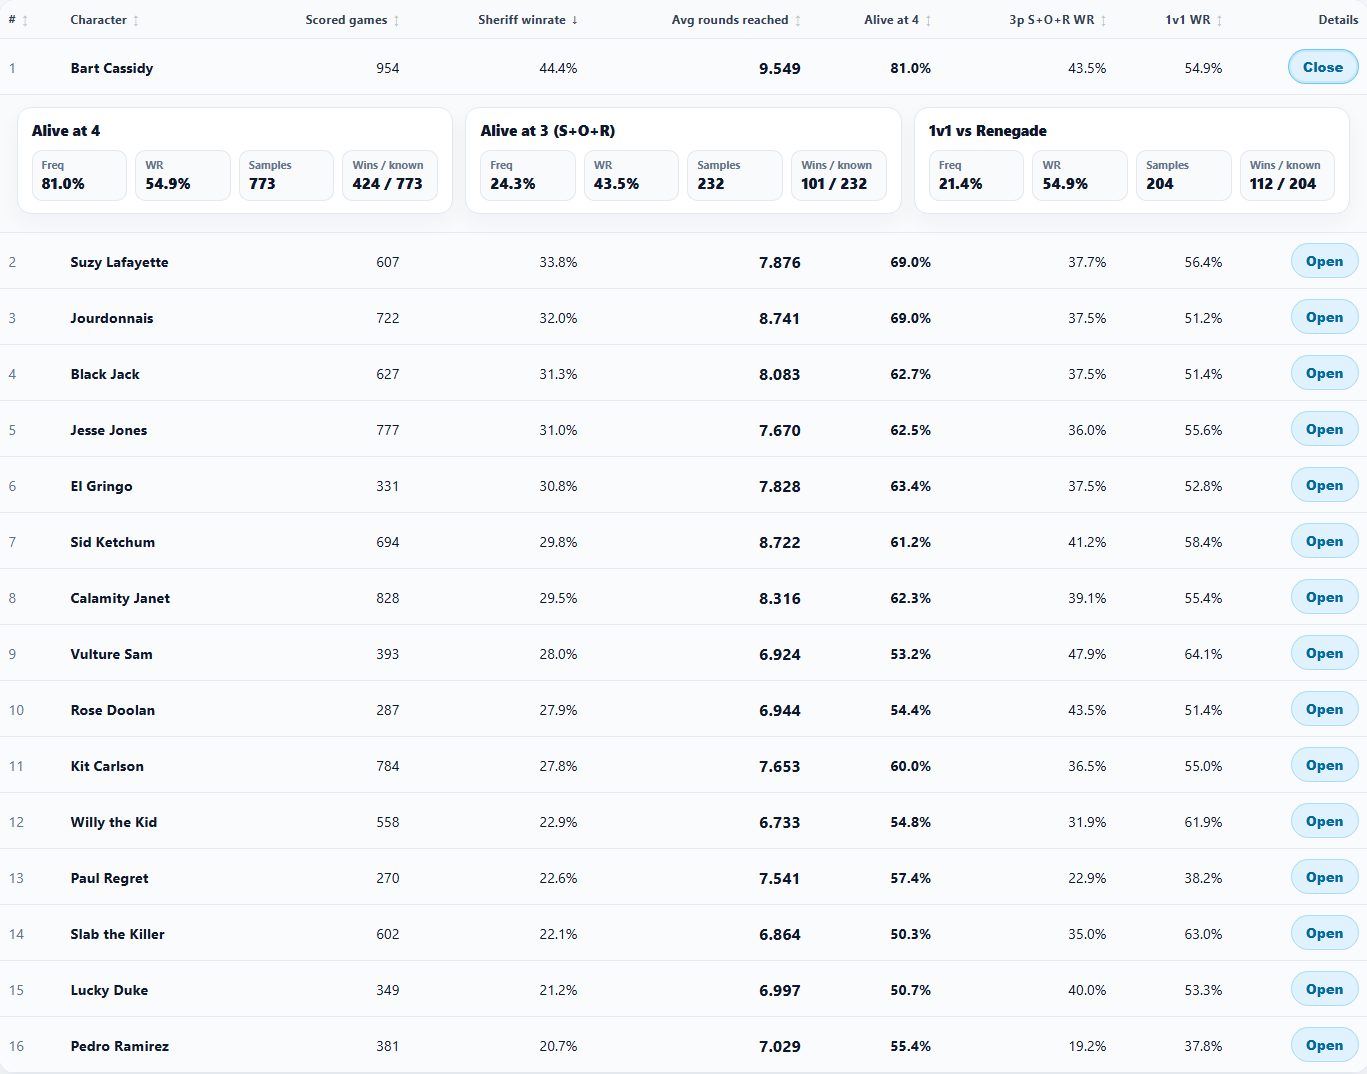
For characters with a sample size below 500 games, the result should not be considered representative. It is only a tendency.
For characters with a sample size above 500 games, the result is much closer to reality. It may still differ from the true value by around 3%, but at this distance the margin of error narrows to roughly that range.
3. The Deputy.
For the Deputy, I calculated an impact coefficient. Here is what it showed.
In the cohort, this coefficient was 4.5. In the overall pool of all Deputies from this slice of games, the coefficient was slightly lower — 4.4 — but that is within normal statistical noise.
Cohort

Overall pool
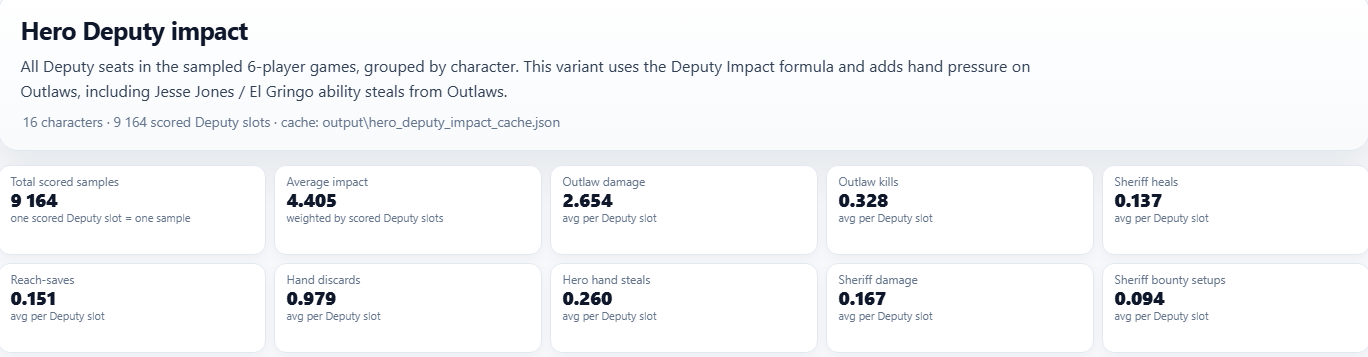
So I would say that the character data for this role should also be close to reality.
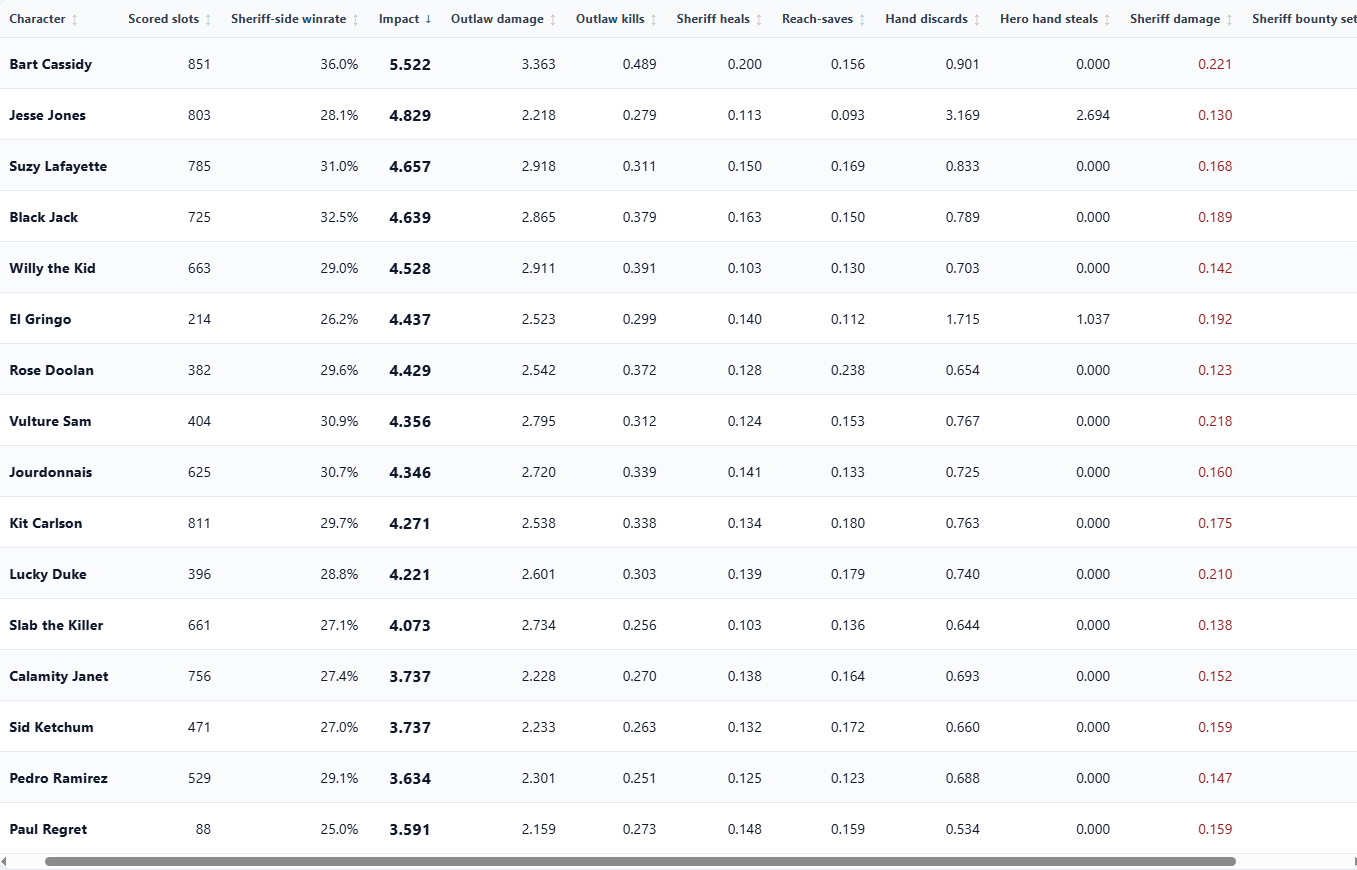
And here you can see the separate components of the coefficient. We can talk about each of them individually.
about Reach Saves for the Deputy.
This metric refers to situations where, as Deputy, we remove an Outlaw’s reach to the Sheriff by using Cat Balou or Panic!.
Why would this stat be different for a strong player compared to an average or weak player?
Here is the insight: a strong player, when playing Deputy, will not usually waste Cat Balou or Panic! just to remove a random card from an opponent’s hand.
A strong player is much more likely to save these rare cards and wait for a situation where they can remove an Outlaw’s weapon — and by doing that, deny that Outlaw the reach to attack the Sheriff.
That is the actual value of this stat.
It shows not just whether the Deputy plays cards, but whether they understand when those cards matter.
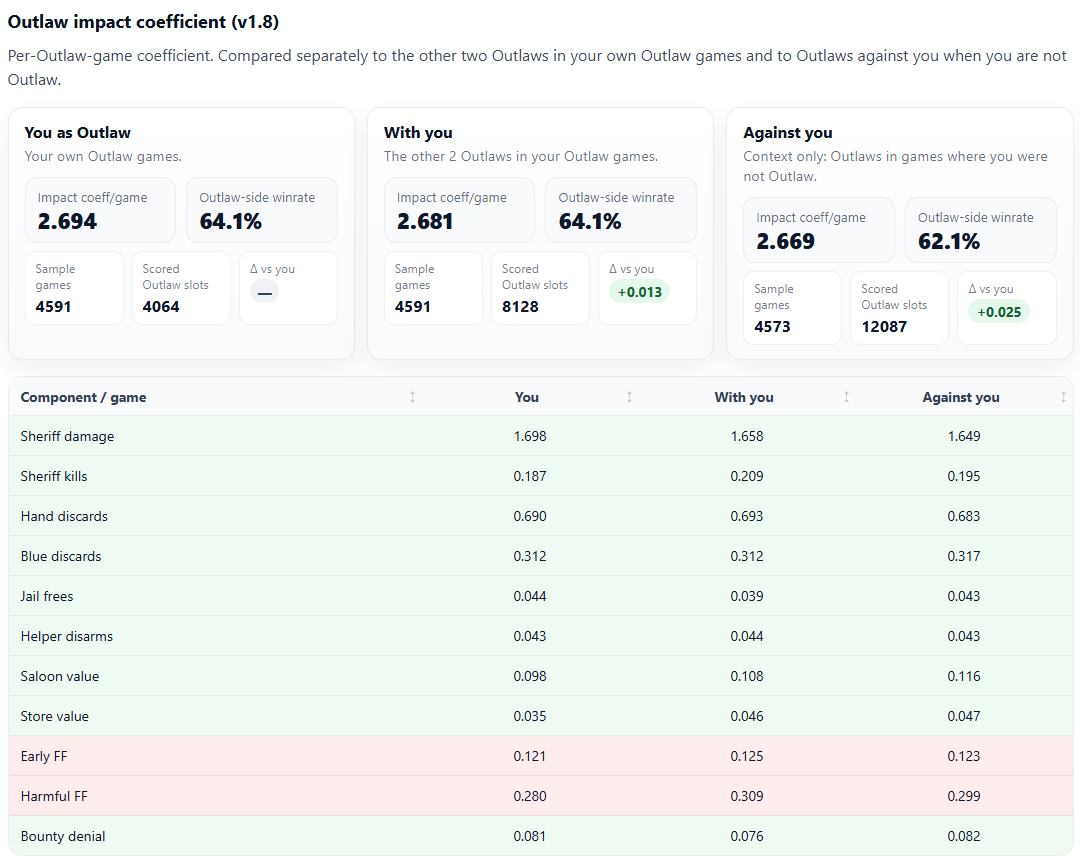
4.the Outlaws, I built an impact coefficient made up of the following components.
In the three top cells, I compared this impact coefficient across three groups:
the players from the cohort,
the players who were teammates of our cohort players,
and the players who were opponents of our cohort players.
And the coefficient turned out to be almost identical across all three groups.
So I can confidently say that the cohort slice fully reflects the average level of the overall player pool on the Outlaw role.
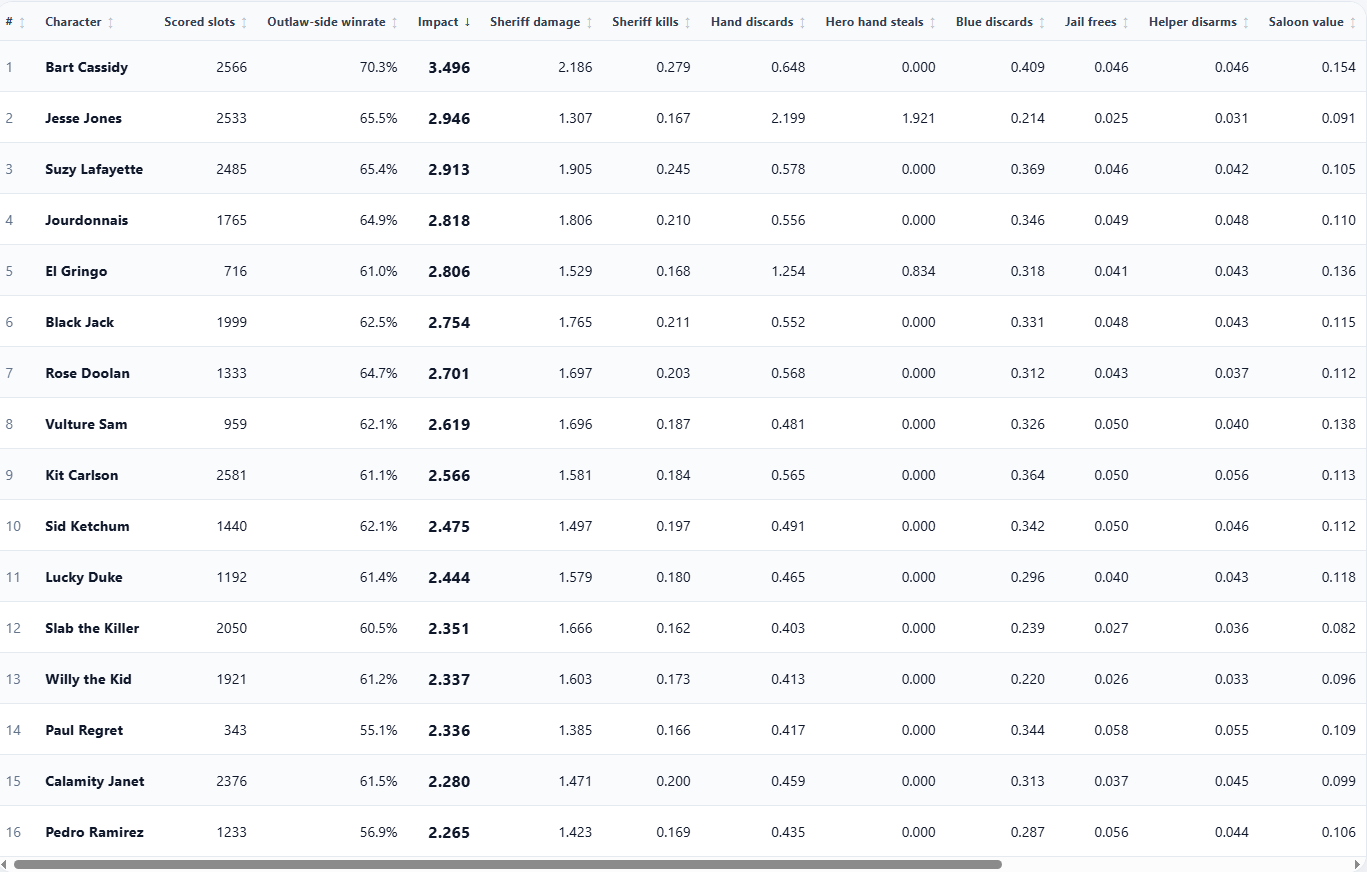
That is why, when I later analyzed the combined pool of all players by character, I believe I obtained the most objective character data from the entire research — at least for the Outlaw role.
The reason is simple: Outlaws had by far the largest number of played slots, and the sample sizes became quite substantial for each individual character.
Cohort
Overall pool

Here are the overall impact coefficient results for the full player pool, as well as the separate results by character.

5.Now, the Renegade.
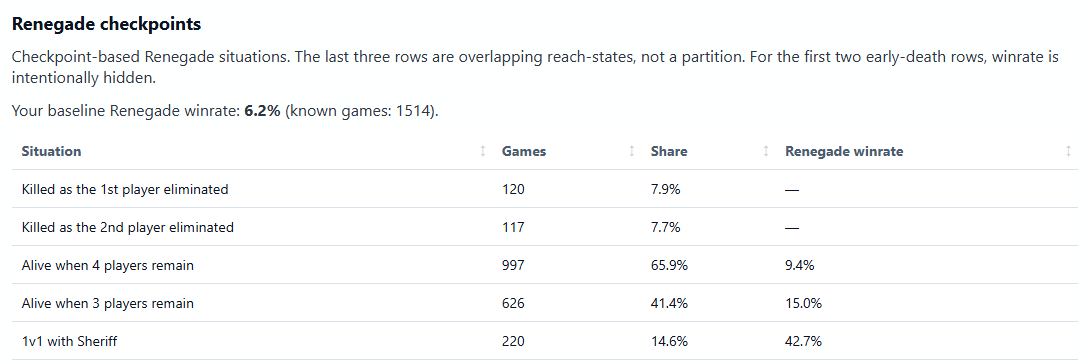
For this role, it is objectively impossible to create one single impact coefficient that would describe his influence on the game. The Renegade is a free artist: depending on the situation at the table, he plays both against one side and against the other.
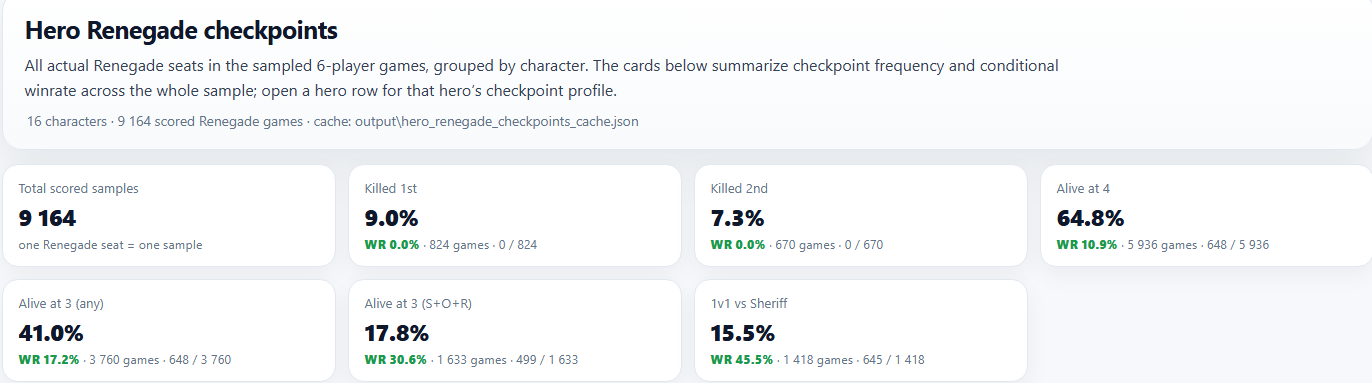
The only thing I could really compare was the tendencies of the cohort and the tendencies of the rest of the player pool. And if those tendencies are at least somewhat close, then maybe I can talk about certain things — for example, that the average win rate of the overall player pool might also be around 6.2%, just like in the cohort.
But the Renegade role is the kind of role that requires much more than 1,500 games to bring the overall field win rate to any objective value.
In other words, this role needs distance.
For strong players, you need at least around 3,000 games, because their win rate is closer to 10–11%, and even then the margin of error of about 1.5% only starts from that kind of sample size.
And if we are talking about an average player, whose win rate is around 6–7%, then you can safely double the number of games required to correctly estimate the average overall win rate for this role across the full player pool.
Still, the tendencies of the cohort do overlap with the tendencies of the rest of the player pool on this role.
But even so, when it comes to global Renegade tendencies across all players, I can only make cautious assumptions.
Cohort
Overall pool
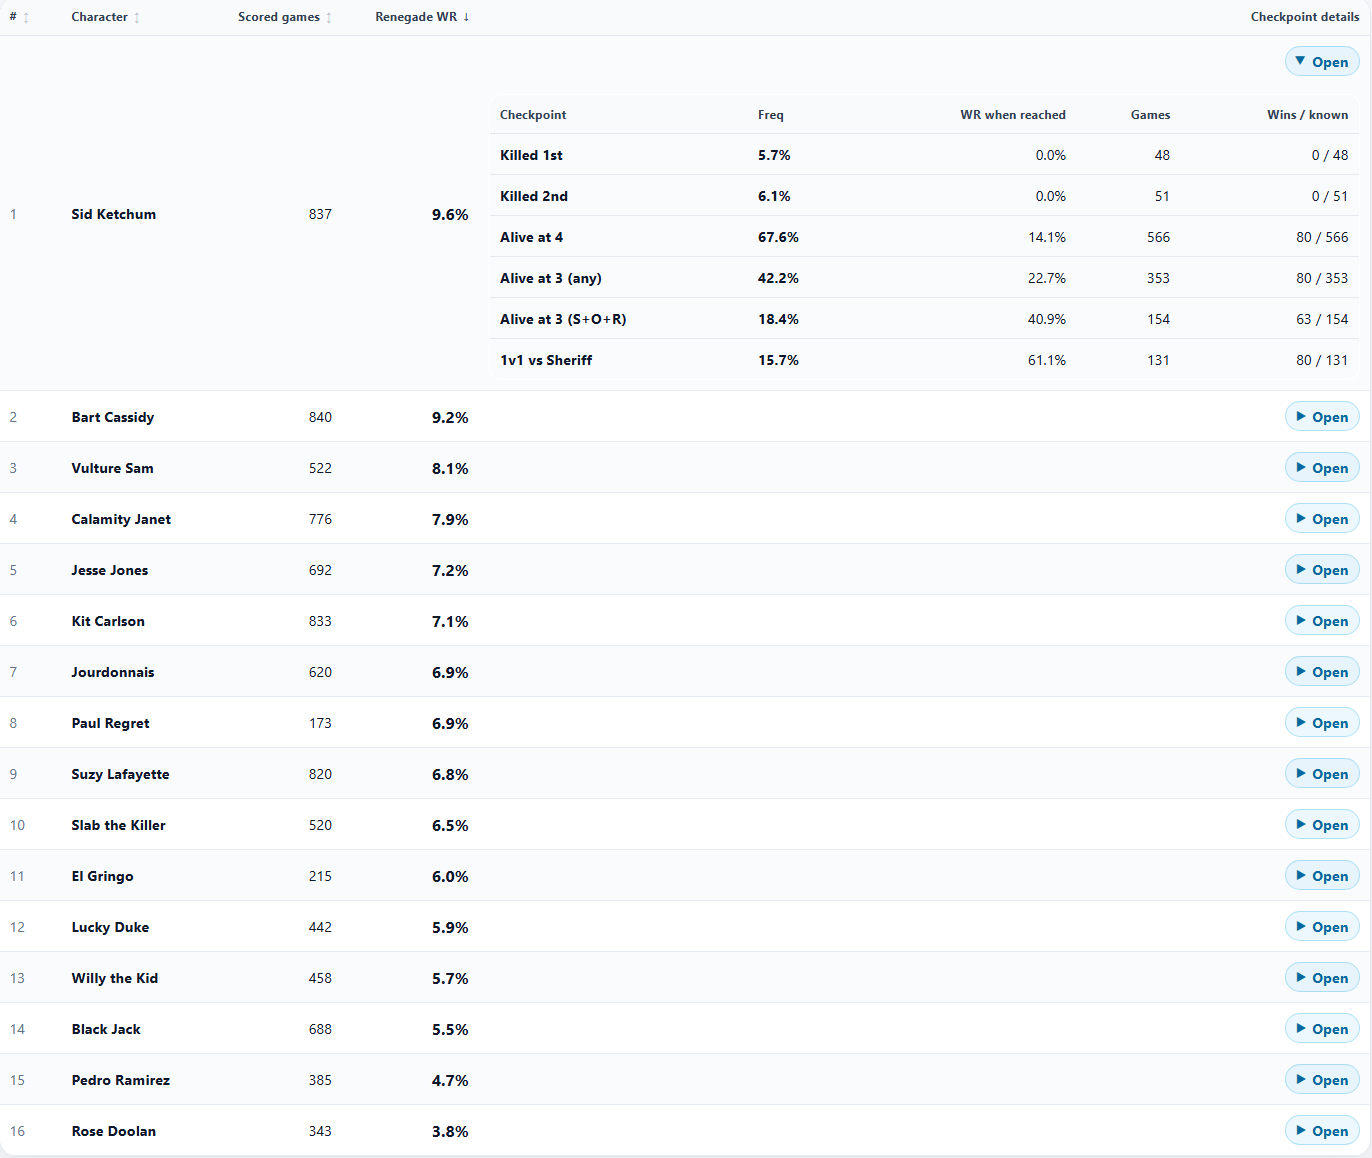
By hero with Sid detailed example
Some additional notes and conclusions.
Each block contains certain insights that could be discussed separately for individual characters.
For example, in the Sheriff block, I was surprised by the low win rate of Calamity Janet and Sid Ketchum. But here I can only talk about my own impressions, because I do not have enough personal sample size on these characters in this role.
Right now, these characters are among my top Sheriff win-rate characters. But again, I do not have enough distance on them personally.
At the same time, in the overall player pool, their Sheriff win rate is very low. So we can say that, on average, people seriously struggle to play these characters well as Sheriff.
For example, Sid Ketchum often uses cards too actively and does not preserve them properly. The same may also be true for Calamity Janet.
But these are only my assumptions, based on observation and personal experience. And experience is a fairly subjective thing, so I will not make any hard claims here.
As for the coefficients I created, obviously these are fairly general metrics for evaluating player level. They consist of repeated actions, because repeated actions are what usually create the skill gap.
There are also micro-moments that can become game-changers in a specific game.
For example, a Deputy may discard Wells Fargo from his hand for his Sheriff, who is playing Pedro Ramirez, so that Pedro can pick up Wells Fargo on his own turn.
These kinds of micro-plays can absolutely become game-changing moments. But they are impossible to properly account for in the data.
They also create a difference between an average player and a strong player.
However, as I already said, the main foundation of the skill difference is hidden in frequently repeated actions.
Micro-moments are so rare that, in my subjective opinion, they probably create only a small win-rate increase. Or maybe a significant one — I simply do not know.
And as a final little extra, I am attaching an informative block about the average number of cards drawn for each character.
This includes both cards drawn per game and cards drawn per round, across all roles.
In the columns, pay attention to the ones called Field Games, Field Cards/Game, and Field Cards/Round.
The columns called My Games or My Cards/Game are not actually about my personal games, because this block comes from the cohort study.
So they should be read as Cohort Games and Cohort Cards/Game.
But as we can see, in the Field Games column, many characters have more than 3,000 games, and so on.
So this is simply general information about how many cards each character tends to draw on average — either per round or per game.

The methodology was as follows. First, I downloaded the full list of participants from Season 24 of Bang! Arena. Then I had to clean the overall player pool a bit: I removed players who technically appeared in the Arena rankings as Bronze, Silver, and so on, but had not really played Arena. I also removed players with a very small number of games, because they do not represent the overall level of the field. Their sample size is too small, so they mostly create background noise.
At the same time, grinders who play a huge number of games also create background noise. So I limited the cohort to 100 games per player. As a result, around 600 players remained in the pool who matched the criteria.
From those players, I randomly selected 100 players. Then, for each of those 100 players, I took 100 Arena games and used that data to build the statistics and estimate the average level of the player base.
I also had to think about how to verify whether the results matched reality. In other words: how does this cohort compare to the entire field, or at least to a representative cross-section of the field? I needed some supporting arguments for that.
For this purpose, I introduced several objective indicators which, in my opinion, could be used to compare how well the cohort matches the overall player pool.
For the Sheriff, the metric was called average rounds reached. This means the average number of rounds a player survives as Sheriff.
For the Outlaws, I introduced an impact coefficient. I also introduced a similar impact coefficient for the Deputy.
Now, let’s go through everything step by step.
1. Overall
2.The Sheriff. In the cohort, the average number of rounds players survive as Sheriff is about 8 rounds. Then I took all Sheriff slots from the games in the cohort — that is more than 9,000 Sheriff slots — and checked whether this metric would be the same there.
And it turned out to be almost identical: the average number of rounds was also about 8, specifically 7.9.
Cohort
Overall pool
From this, I concluded that, at least for Sheriffs, the cohort matches the overall player pool quite well. Therefore, the character results from the cohort game pool should approximately reflect reality.
And the reality is the following.
Here are the screenshots where I show the Sheriff character results. In the columns, you can see the Sheriff win rate for each character across the overall player pool from the cohort games.
There are enough samples here to draw some conclusions.
You can also see a column for each character’s average rounds reached, meaning how long they survive on average as Sheriff. There are also some specific situations, such as win rate in a three-player endgame, and win rate in a 1v1 against the Renegade.
However, for those specific situations, the sample size is quite small. So we can only talk about tendencies there.
For characters with a sample size below 500 games, the result should not be considered representative. It is only a tendency.
For characters with a sample size above 500 games, the result is much closer to reality. It may still differ from the true value by around 3%, but at this distance the margin of error narrows to roughly that range.
3. The Deputy.
For the Deputy, I calculated an impact coefficient. Here is what it showed.
In the cohort, this coefficient was 4.5. In the overall pool of all Deputies from this slice of games, the coefficient was slightly lower — 4.4 — but that is within normal statistical noise.
Cohort
Overall pool
So I would say that the character data for this role should also be close to reality.
And here you can see the separate components of the coefficient. We can talk about each of them individually.
about Reach Saves for the Deputy.
This metric refers to situations where, as Deputy, we remove an Outlaw’s reach to the Sheriff by using Cat Balou or Panic!.
Why would this stat be different for a strong player compared to an average or weak player?
Here is the insight: a strong player, when playing Deputy, will not usually waste Cat Balou or Panic! just to remove a random card from an opponent’s hand.
A strong player is much more likely to save these rare cards and wait for a situation where they can remove an Outlaw’s weapon — and by doing that, deny that Outlaw the reach to attack the Sheriff.
That is the actual value of this stat.
It shows not just whether the Deputy plays cards, but whether they understand when those cards matter.
4.the Outlaws, I built an impact coefficient made up of the following components.
In the three top cells, I compared this impact coefficient across three groups:
the players from the cohort,
the players who were teammates of our cohort players,
and the players who were opponents of our cohort players.
And the coefficient turned out to be almost identical across all three groups.
So I can confidently say that the cohort slice fully reflects the average level of the overall player pool on the Outlaw role.
That is why, when I later analyzed the combined pool of all players by character, I believe I obtained the most objective character data from the entire research — at least for the Outlaw role.
The reason is simple: Outlaws had by far the largest number of played slots, and the sample sizes became quite substantial for each individual character.
Cohort
Overall pool
Here are the overall impact coefficient results for the full player pool, as well as the separate results by character.
5.Now, the Renegade.
For this role, it is objectively impossible to create one single impact coefficient that would describe his influence on the game. The Renegade is a free artist: depending on the situation at the table, he plays both against one side and against the other.
The only thing I could really compare was the tendencies of the cohort and the tendencies of the rest of the player pool. And if those tendencies are at least somewhat close, then maybe I can talk about certain things — for example, that the average win rate of the overall player pool might also be around 6.2%, just like in the cohort.
But the Renegade role is the kind of role that requires much more than 1,500 games to bring the overall field win rate to any objective value.
In other words, this role needs distance.
For strong players, you need at least around 3,000 games, because their win rate is closer to 10–11%, and even then the margin of error of about 1.5% only starts from that kind of sample size.
And if we are talking about an average player, whose win rate is around 6–7%, then you can safely double the number of games required to correctly estimate the average overall win rate for this role across the full player pool.
Still, the tendencies of the cohort do overlap with the tendencies of the rest of the player pool on this role.
But even so, when it comes to global Renegade tendencies across all players, I can only make cautious assumptions.
Cohort
Overall pool
By hero with Sid detailed example
Some additional notes and conclusions.
Each block contains certain insights that could be discussed separately for individual characters.
For example, in the Sheriff block, I was surprised by the low win rate of Calamity Janet and Sid Ketchum. But here I can only talk about my own impressions, because I do not have enough personal sample size on these characters in this role.
Right now, these characters are among my top Sheriff win-rate characters. But again, I do not have enough distance on them personally.
At the same time, in the overall player pool, their Sheriff win rate is very low. So we can say that, on average, people seriously struggle to play these characters well as Sheriff.
For example, Sid Ketchum often uses cards too actively and does not preserve them properly. The same may also be true for Calamity Janet.
But these are only my assumptions, based on observation and personal experience. And experience is a fairly subjective thing, so I will not make any hard claims here.
As for the coefficients I created, obviously these are fairly general metrics for evaluating player level. They consist of repeated actions, because repeated actions are what usually create the skill gap.
There are also micro-moments that can become game-changers in a specific game.
For example, a Deputy may discard Wells Fargo from his hand for his Sheriff, who is playing Pedro Ramirez, so that Pedro can pick up Wells Fargo on his own turn.
These kinds of micro-plays can absolutely become game-changing moments. But they are impossible to properly account for in the data.
They also create a difference between an average player and a strong player.
However, as I already said, the main foundation of the skill difference is hidden in frequently repeated actions.
Micro-moments are so rare that, in my subjective opinion, they probably create only a small win-rate increase. Or maybe a significant one — I simply do not know.
And as a final little extra, I am attaching an informative block about the average number of cards drawn for each character.
This includes both cards drawn per game and cards drawn per round, across all roles.
In the columns, pay attention to the ones called Field Games, Field Cards/Game, and Field Cards/Round.
The columns called My Games or My Cards/Game are not actually about my personal games, because this block comes from the cohort study.
So they should be read as Cohort Games and Cohort Cards/Game.
But as we can see, in the Field Games column, many characters have more than 3,000 games, and so on.
So this is simply general information about how many cards each character tends to draw on average — either per round or per game.


